Finally the time has come for the follow-up of this series about the Radiation Watch Pocket Geiger counter.
In the first part we were logging the Pocket Geiger measurements to an SD card with an Arduino. As my title promises a Geiger counter for your house, we need to do better! Like something actually connected.
Getting connected with Raspberry Pi
Indeed it would be great to post the radiation level online in real-time. To realize this mission we need a board that can be easily connected to internet, and that is obviously able to speak with our Pocket Geiger. Guess what? This is exactly what Raspberry Pi is great at!
Instead of connecting our Pocket Geiger to an Arduino we will wire it to the Raspberry Pi GPIO ports. We will benefit the Raspberry Pi generous package: Ethernet and USB ports, so the network access is simple ; HDMI output, so we can check on a screen what’s going on. The Raspberry Pi ARM chip is also way more powerful than the Arduino Uno ATmega328 microcontroller: it can honorably run a whole GNU/Linux distribution. With the dedicated Raspbian OS - a Debian-fork for… yes Raspberry Pi! - we will enjoy a familiar and welcoming environment.
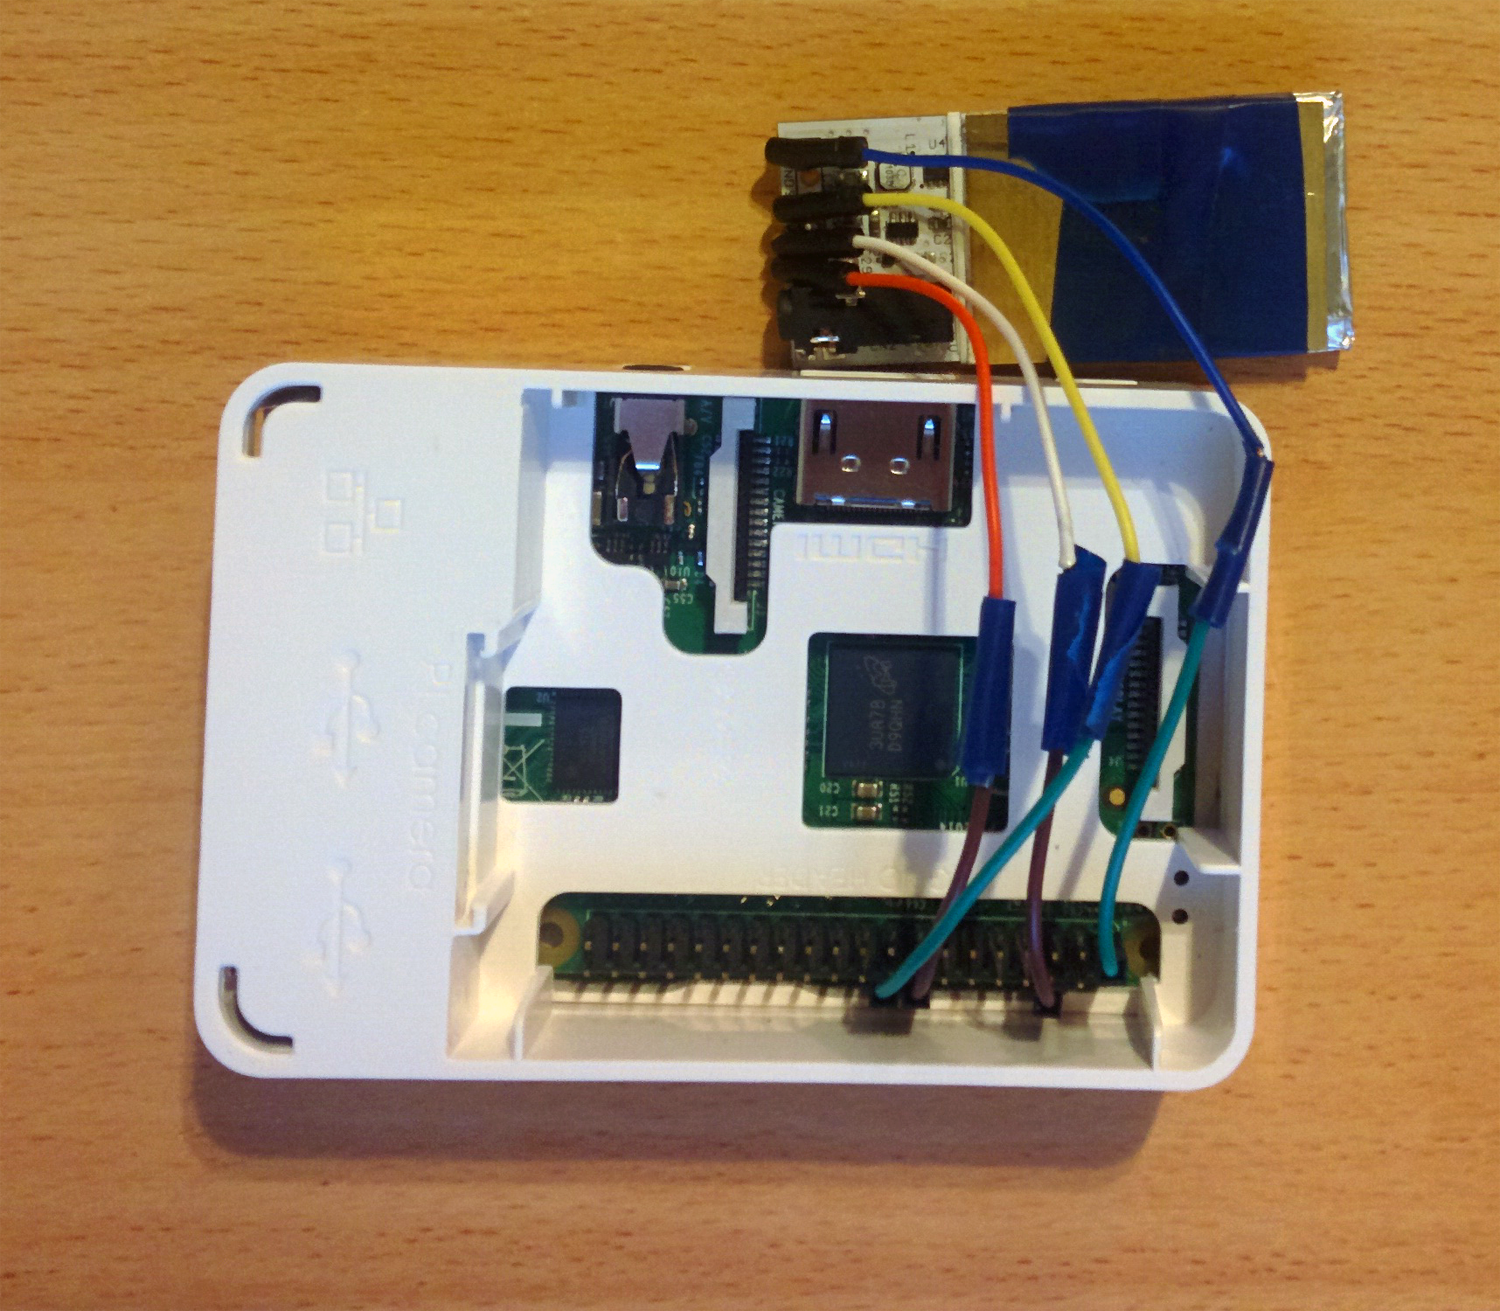
Having the Pocket Geiger linked to the Raspberry Pi is exciting, however that doesn’t bring much in itself. Without software hardware’s of no use! We need a way to communicate with the Pocket Geiger and get back the readings to our Raspberry Pi.
Have hardware, need software
As I haven’t found something that really convinced me1, I developed a Python library to communicate with the PocketGeiger: please welcome the PiPocketGeiger library.
The PiPocketGeiger library is built on top of the RPi.GPIO package. It uses edge detection interrupts to count the ionization events and periodically processes the current dose in a thread. This is roughly a Python rewrite of the Arduino library C code.
A major difference with the Arduino version is that Linux is not a hard real-time OS2, so we have no guarantee we’re effectively monitoring the edge falling in a timely manner. That said the timing of an interrupt from the Pocket Geiger3 makes it unlikely that we miss a wild Gamma ray. However I’m not competent enough on the subject to be definitive.
Install the Gamma Ball
You can install the library using pip. The RPi.GPIO package needs root privileges to access to the hardware, I thus recommend to install the lib root-wide:
sudo install pip PiPocketGeigerThat done you can use the lib in your Python script. You firstly initialize the lib to indicates which GPIO pins to read from. Then you can get the current background computed radiation level whenever you need:
# We initialize the lib with respectively the radiation signal and noise pins number.
with RadiationWatch(24, 23) as radiationWatch:
    print(radiationWatch.status())
    # {'duration': 14.9, 'uSvh': 0.081, 'uSvhError': 0.081, 'cpm': 4.29}
For those that already ask for reactive applications, yes you can register callbacks that will be triggered when a gamma ray drop on the Pocket Geiger, or when there is noisy events:
def onRadiation():
    print("Ray appeared!")
def onNoise():
    print("Vibration! Stop moving!")
with RadiationWatch(24, 23) as radiationWatch:
   radiationWatch.registerRadiationCallback(onRadiation)
   radiationWatch.registerNoiseCallback(onNoise)
   while 1:
       time.sleep(1)
Real-time online publishing
To truly benefit the power of our Raspberry Pi the library provides examples to publish the data in live on various web services.
First typical application we can live-tweet the radiation level in our house, so nobody miss you’re hacking:
Radiation in my house (Laussou, France): 0.059 uSv/h +/- 0.012 -- 3.12 CPM @radiation_watch
— Yoan Tournade (@tournadey) 16 décembre 2015
Instead of simply logging to a file on your Rapsberry Pi you can log to your Google Drive account:
These examples are fine to keep trace of raw data, but not quite handy to visualize it. We can use Plotly, a great service to create and share plots:
For the next part we will make all that more open - I mean more open-data oriented. Coming soon. Hopefully. Yeah we’re pretty lazy here.
Edit March 30th, 2016: Here it is!
Notes
1. There is this C driver that seems to work fine (haven’t tested it), but I wanted a pure Python interface and a lib that can be easily distributed and installed with pip.
2. This comment apply only for the standard Raspbian distribution, has it does exist a patched version of Linux for real-time applications: the RT-Preempt Patch, that gives hard real-time capabilites to the kernel. You may also check the Xenomai or RTLinux projects, which each kind of make cohabit a hard real-time kernel with the Linux one, ensuring the whole can be preempted in a deterministic way.
3. The Radiation Watch sample code says the Radiation pulse normally keeps low for about 100 microseconds.