As I was working on a signal processing project for Equisense, I’ve come to need an equivalent
of the MatLab findpeaks function in the Python world.
Detecting peaks with MatLab
For those not familiar to digital signal processing, peak detection is as easy to understand as it sounds: this is the process of finding peaks - we also names them local maxima or local minima - in a signal. The MatLab DSP Toolbox makes this super easy with its findpeaks function. Saying your want to search local maxima in an audio signal, for example 2000 samples of the Laurent Garnier famous track Cripsy Bacon, all you have to do is:
cb = audioread('Crispy_Bacon.wav');
findpeaks(cb(50061:52060), 'MinPeakDistance', 100, 'MinPeakHeight', 0.04)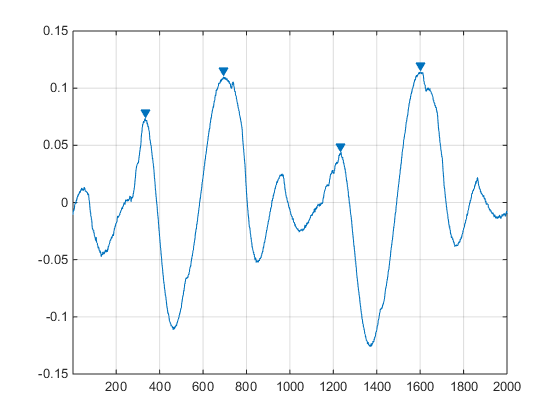
We can specify filtering options to the function so the peaks that do not interest us are discarded. All this is great, but we need something working in Python. In a perfect world it will give exactly the same output, so we have consistent results between our Python code and the MatLab code.
The Scipy try
Contrary to other MatLab functions that have direct equivalents in the Numpy and Scipy scientific and processing packages, it is no easy task to get the same results from the Scipy find_peaks_cwt function that from the MatLab findpeaks. Even worse, the wavelet convolution approach of find_peaks_cwt is not straightforward to work with: it adds complexity that is of no use for well-filtered and noiseless signals.
import numpy as np
from scipy.signal import find_peaks_cwt
cb = np.array([-0.010223, ... ])
indexes = find_peaks_cwt(cb, np.arange(1, 550))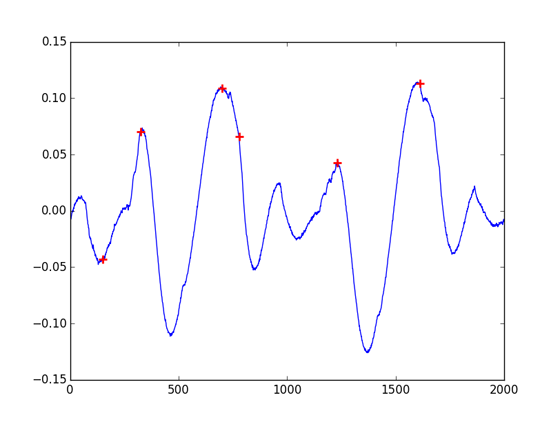
Into the wild
Wondering how to make our algorithms works as simply with Python that they were in MatLab, I’ve search around the web for other peak detection algorithms available in Python. Stackoverflow get me to peakdetect, a translation of a MatLab script. As it is clearly more trivial to use that find_peaks_cwt, it still won’t give you the same results that the MatLab findpeaks function. The algorithm don’t find all peaks on low sampled signals or on short samples, and don’t have either a support for minimum peak height filter.
import numpy as np
from peakdetect import peakdetect
cb = np.array([-0.010223, ... ])
peaks = peakdetect(cb, lookahead=100)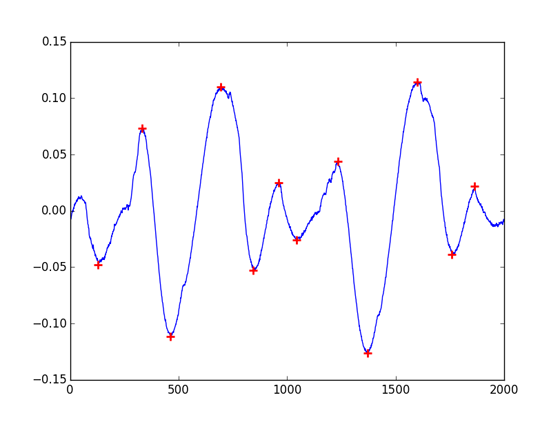
Octave One
Going ahead I’ve checkout the GNU Octave project, a processing-intended language quite similar to MatLab. The Octave-Forge repository hosts a digital signal processing package with a findpeaks function. Bingo? Well, yes and no. The function have an appealing interface, with a great filtering support. But this is not a Python project: as you’ll find ways to call your Octave distribution from your Python code (see oct2py), it surely won’t be effective at large scale and makes the requirements for your code more complex.
import numpy as np
from oct2py import octave
cb = np.array([-0.010223, ... ])
octave.eval("pkg load signal")
(peaks, indexes) = octave.findpeaks(cb, 'DoubleSided', 'MinPeakHeight', 0.04, 'MinPeakDistance', 100, 'MinPeakWidth', 0)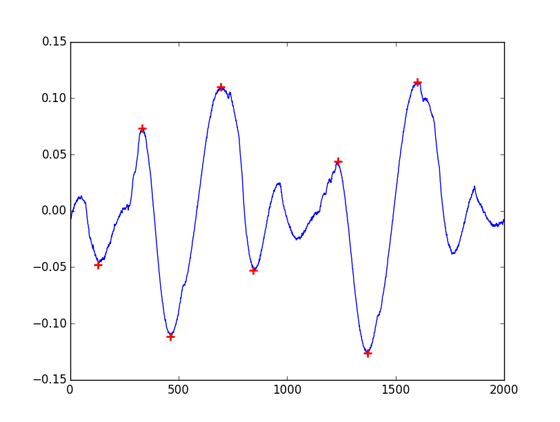
The PyPi Wonderland
As I was going to code a Python adaptation of the Octave-Force findpeaks, I finally found what I was searching: a Python native equivalent of the MatLab findpeaks, with minimum distance and height filtering support. I even found two!
The first is the PeakUtils package by Lucas Hermann Negri which provides 1D peak detection utilities. Its indexes function allows you to detect peaks with minimum height and distance filtering.
import numpy as np
import peakutils
cb = np.array([-0.010223, ... ])
indexes = peakutils.indexes(cb, thres=0.02/max(cb), min_dist=100)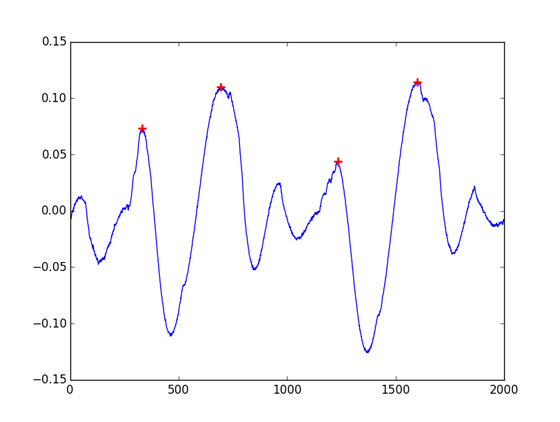
Going through space
The second is published on a jupyter notebook and is written by Marcos Duarte. Not easy to find, but the greatest so far for what I need: the parameters for filtering are modeled after the MatLab findpeaks ones. It comes as a single source file and only depends on Numpy, so it is no big deal to integrate. And more importantly, it will consistently get you the same results than MalLab findpeaks!
import numpy as np
from detect_peaks import detect_peaks
cb = np.array([-0.010223, ... ])
indexes = detect_peaks(cb, mph=0.04, mpd=100)To avoid others the same roaming I’ve put on GitHub an overview of these findings. Let me know if you got another open-source alternatives so we update the list.
Edit 17th November
As Lucas Hermann Negri pointed out on HN, the PeakUtils indexes function was actually inspired by Marcos Duarte implementation of detect_peaks, explaining the similar results. Moreover he notes that the PeakUtils comes with other convenient utilities, such as baseline or interpolate.
The interpolate function enhances the peak resolution by fitting Gaussians or computing centroids. Taking the previous example, here how you get it work:
import numpy as np
import peakutils
cb = np.array([-0.010223, ... ])
indexes = peakutils.indexes(cb, thres=0.02/max(cb), min_dist=100)
# [ 333  693 1234 1600]
interpolatedIndexes = peakutils.interpolate(range(0, len(cb)), cb, ind=indexes)
# [  332.61234263   694.94831376  1231.92840845  1600.52446335]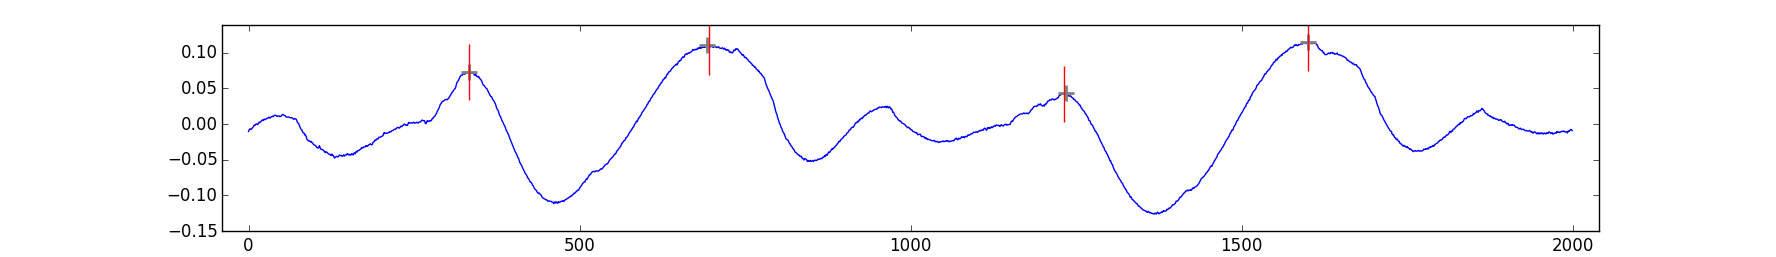
This time before the peak resolution, the baseline function will be very handy in presence of drifting signals or to deal with unwanted low-frequency phenomenon: it kind of high-pass filter the signal. The PeakUtils documentation have a good example of its use.